ACTL4001 Case Report
Control-Cycle
Table of Contents
- Andrew Uen
- Alastair Nicholls
- Danny Lim
- Kai Zhi Lim
- Kelly Chu
About the Project
Football is a sport loved and played by billions worldwide. Beyond this, football can provide countries with opportunities for economic gain, global visibility and improved social outcomes.
In recognizing this, the country of Rarita has engaged our team to develop a strategy for entering the international Football and Sporting Association (“FSA”) League and develop a Rarita Football brand.
This GitHub repository documents the code and methodology use in completing the Society of Actuaries Research Institute 2022 Research Challenge.
For an in-depth exploration of our methodology, assumptions and strategy, please refer to the Control Cycle - Rarita FSA League Report.
Project Summary
Rarita Football Team Selection
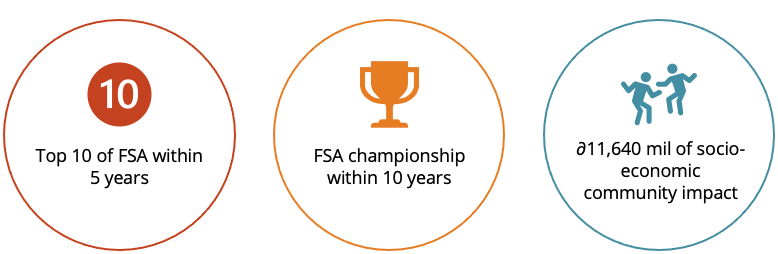
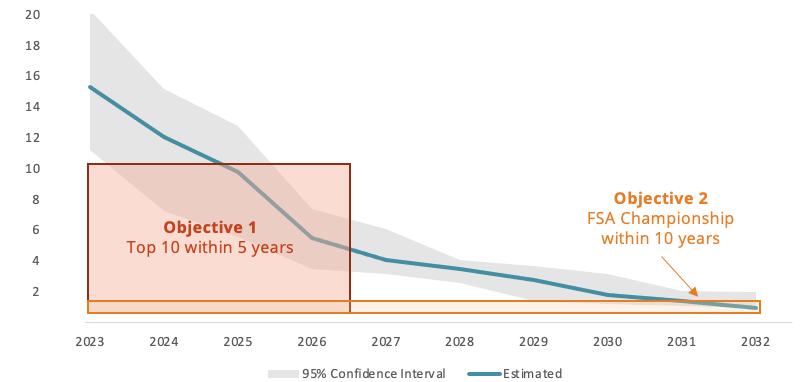
The project began with the process of team selection which involves identifying key selection criteria and then applying it through a predictive model to select the most competitive team. Through the selection of a high performing team, Rarita has strong chances of placing within the top 10 and achieving the FSA championship within 10 years.
Economic Impact
With such achievements, the resulting commercial success creates a cycle of strategic growth by generating sufficient resources to allow implementation of key strategies which support the development of players to their maximum potential whilst engaging the broader community.
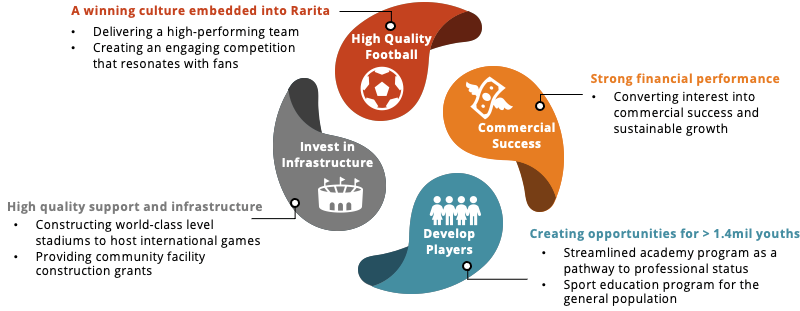
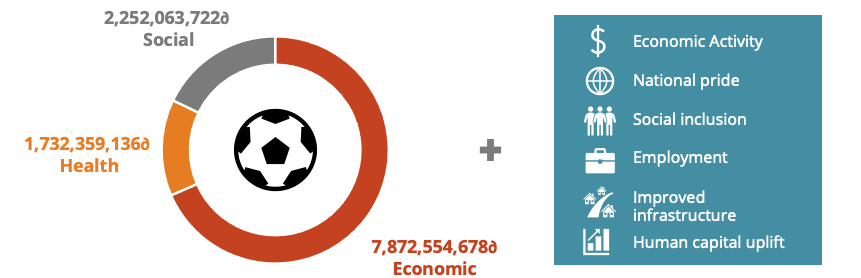
Through our two expenditure programs, investments are aimed at the grassroots level, allowing an equitable re-distribution of profits to improve the general quality of life and wellbeing. Ultimately, our strategies will guarantee sustainable and profitable growth, creating on average over ∂11.64 billion worth of annual socio-economic benefits.
For exploration of financial modelling and underlying assumptions, please refer to the Excel Model.
Project Methodology
To create a robust model to select the players of the Rarita Football Team, data from the English Premier League (EPL) was used as the training data. The EPL data was split according to the player’s roles, namely the Forwards, Midfielders, Defenders and Goalkeepers. A series of models, including XGBoost and Regularised Linear Regression were trained on the EPL dataset.
The tournament dataset was then used as the testing data, and the model with the lowest prediction error was selected as the ideal model for each player position.
Soccer Power Index
ESPN’s Soccer Power Index (SPI) is an international and club rating system and is designed to provide the best possible objective rating of a team’s current overall skill level. The use of a team’s SPI aims to predict which teams will have the most success going forward (Silver, 2009). Though it may not accurately predict goal scorings and results on a match-level, it accounts for a series of different factors that can affect the outcome of the team’s performance in the league as a whole, including:
- Importance of match (e.g., final game of a tournament)
- Time effect such that the most recently played matches are given a more significant weighting
- Home-field advantage
Position Specific Variables
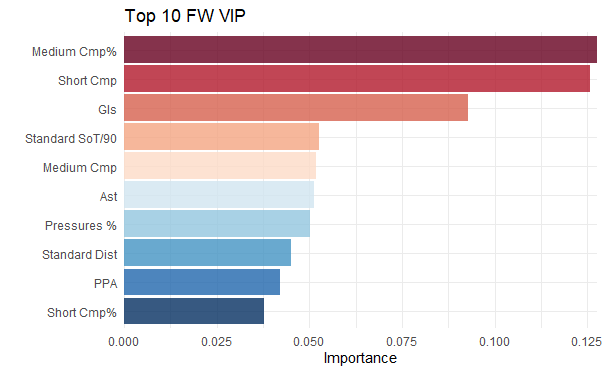
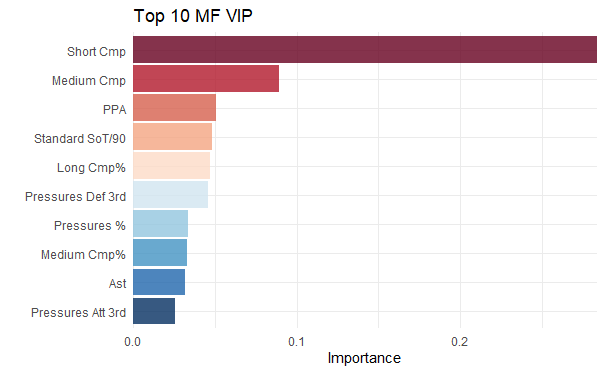
To evaluate which variables had the largest impact on the SPI of each position, the variable importance plot are shown for each position, below:
Forward
Midfielders
Defenders
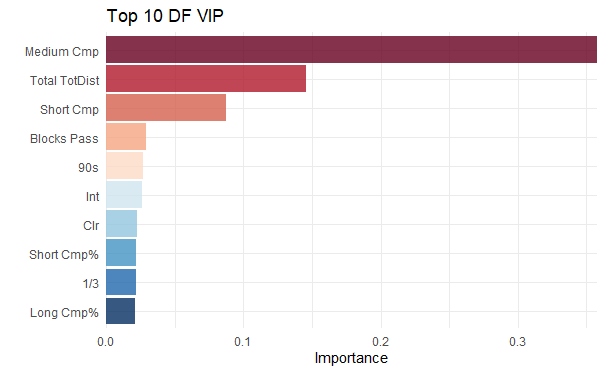
In general, the largest indicator of SPI were the player passing rates. For Midfielders and Defenders, short and medium passes completed respectively were key indicators of SPI. Looking at the non-passing completed variables, Midfielders prioritized passes completed to the 18-yard box while Defenders prioritized total distance passed and blocked passes.
However, for Fowards no one clear variable stood out. The variable importance declined more gradually, with goals, assists, pressures and shots on target being key variables along with the normal passing ones. Intuitively, this is because each team would have a primary striker that is supported by the other forwards.
Model Analysis
To further understand the methodology used, explore the R Markdown documents below:
Conclusion
Ultimately, through our team selection and implementation strategies, we expect Rarita to achieve the below three objectives and successfully develop a Rarita Football brand over the next ten years.